.png?width=512&height=130&name=vantage-logo(2).png "Vantage Partners")

Leaders have more data, and more timely data, at their fingertips than ever before. But too often, access to more and better data doesn’t translate to better insights. Metrics are frequently defined based on what is what easiest to measure. But as the old saw goes, not everything that counts can be counted, and not everything that can be counted counts.
Moreover, over-measurement can be as great a challenge as under-measurement. Collecting and analyzing data, and reporting on metrics, takes time and effort – even with tools for automation. Effective visualization can help separate noise from signal, but metrics overload remains a problem for many organizations and their leaders.
Most of the literature on metrics focuses on the merits of specific measures (e.g., perfect orders for procurement managers, customer lifetime value for sales executives). But what is most useful for one company may be less relevant for another – individual companies and their strategies differ significantly. In addition, while tracking consistent metrics over time has value, a dynamic business environment means constantly shifting challenges and opportunities – which in turn call for different metrics to inform strategic decision-making and guide execution. A more bespoke, and more agile, approach to metrics is called for.
Below are four principles for defining and applying fit-for-purpose metrics.
1. Start by creating a causal map of problems (or opportunities). Before asking “What metrics do we need to manage our business?” first consider what are the most significant problems or opportunities the business is facing. Next, diagnose problem causes and barriers to success – and then decide what actions are required to address them. Metrics should enable tracking that these actions are in fact taken (leading indicators that create accountability for execution). They should also measure consequent results, and the value associated with those results (lagging indicators that validate, or invalidate hypotheses about challenges and opportunities, ensure that actions are having the desired impact, and enable course correction and continuous improvement).
Figure A: Causal mapping framework – a supply management case study
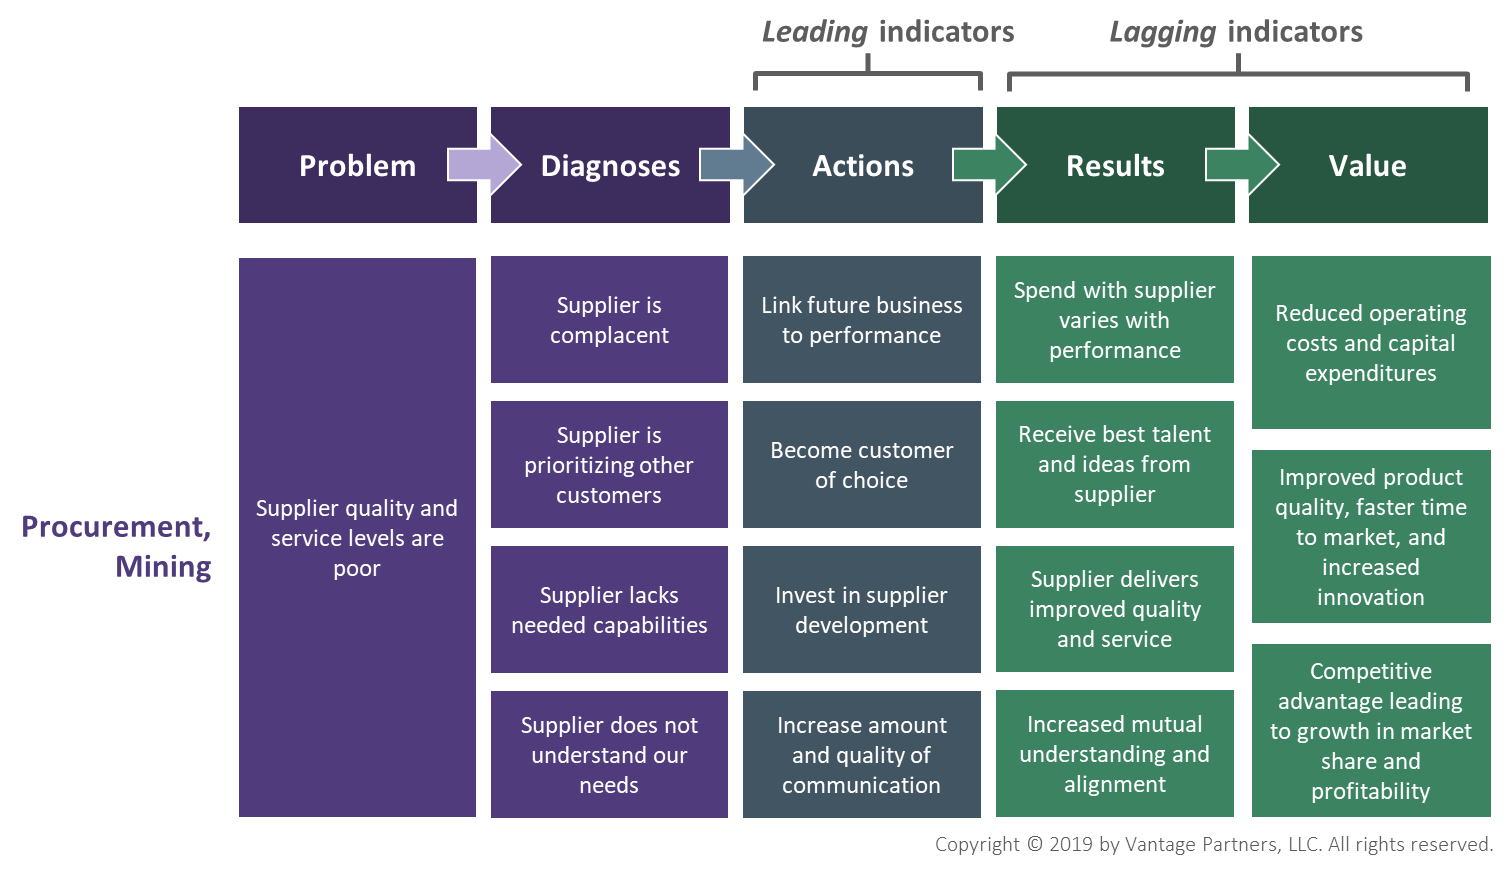
In the example above, a Procurement organization confronted poor supplier quality and service. Four possible diagnoses were identified, each calling for different solutions. Defining and tracking key metrics across this casual lifecycle ensured attention and effort was focused on critical activities that delivered value to the business.
2. Watch out for unintended consequences. Decades of research show that individual behavior in organizations is highly influenced by what is measured and reported. Unfortunately, those who design metrics do not always consider what incentives they are creating. Causal mapping not only helps to illuminate the potential incentive impact of different metrics, it can also aid leaders in clearly communicating strategies, so that the rank and file do not rely on simply on what is measured to infer what is important. One software company’s experience offers a cautionary tale. To increase sales, they implemented a “feed the funnel” metric. Below is the implicit causal mapping suggested by a focus on this metric, though the company did not in fact undertake a causal mapping exercise – to their detriment.
Figure B: Software company case study
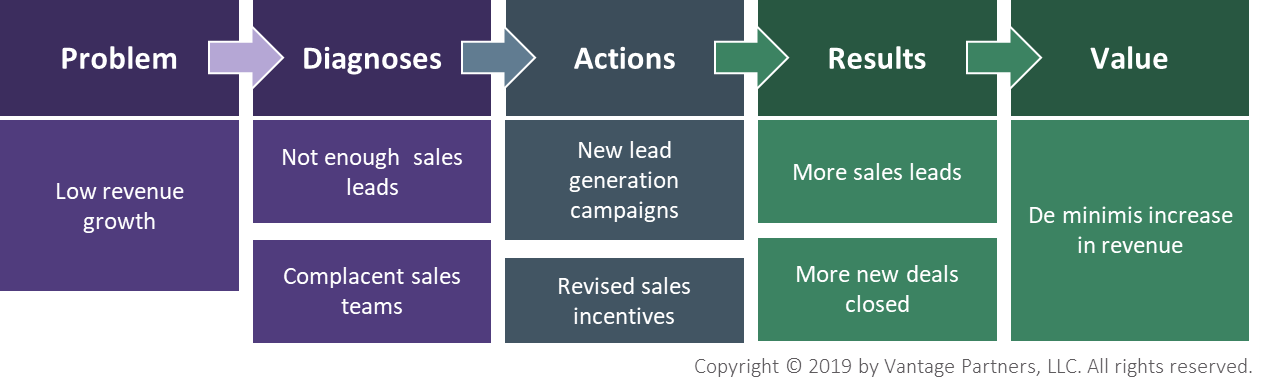
While the company did increase sales, teams invested a huge amount of time selling to, training, and onboarding low-yield customers. (The company’s main revenue source was a subscription software product where revenue depended on usage, and on high renewal rates). The metrics encouraged more new leads, but not necessarily quality leads, leading to sales that did not yield significant revenue.
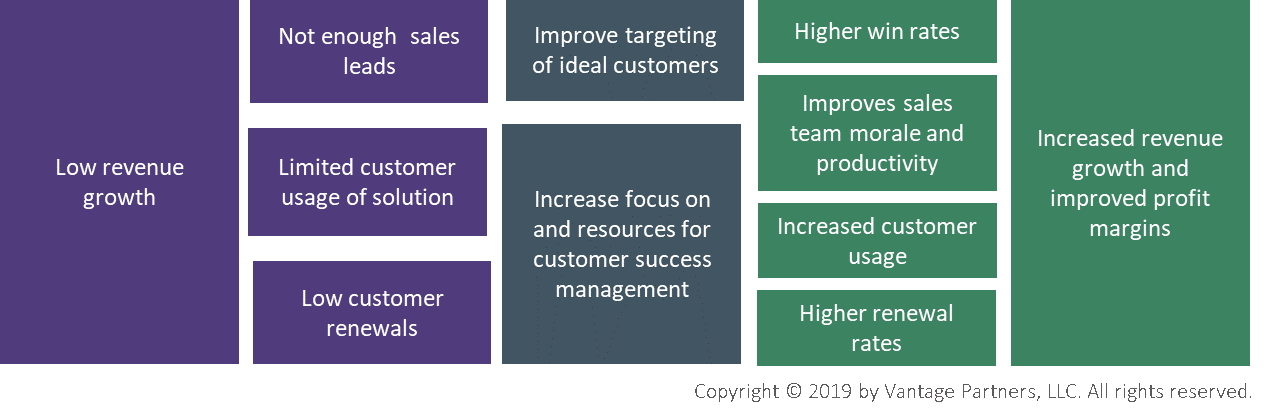
Below is an example of a more robust causal mapping yielding different metrics, better aligned with the actual challenges the company was facing, and actions they could take to generate better results.
Figure C: Software company case study (continued)
3. Balance consistency with agility. There is great value in trend data, which allows companies to track and improve performance over time, and which can provide early warning of changes in the business environment. But as circumstances and strategies evolve, metrics also need to change. Most companies err on the side of maintaining metrics for too long – after they’ve become irrelevant in context of shifts in strategy or the external market. As new metrics – related to new problems – are created, leaders should look for opportunities to retire older, less relevant metrics. Core metrics (such as operating margin, fixed and variable costs, win rates, internal rates of return on capital investments, etc.) should be maintained, but other measures should be regularly reevaluated. Simple questions can be used to test relevance: Are we using this data to make decisions or guide action? Is the metric stable and if so, do we have specific reason to believe that it could change materially in the future?
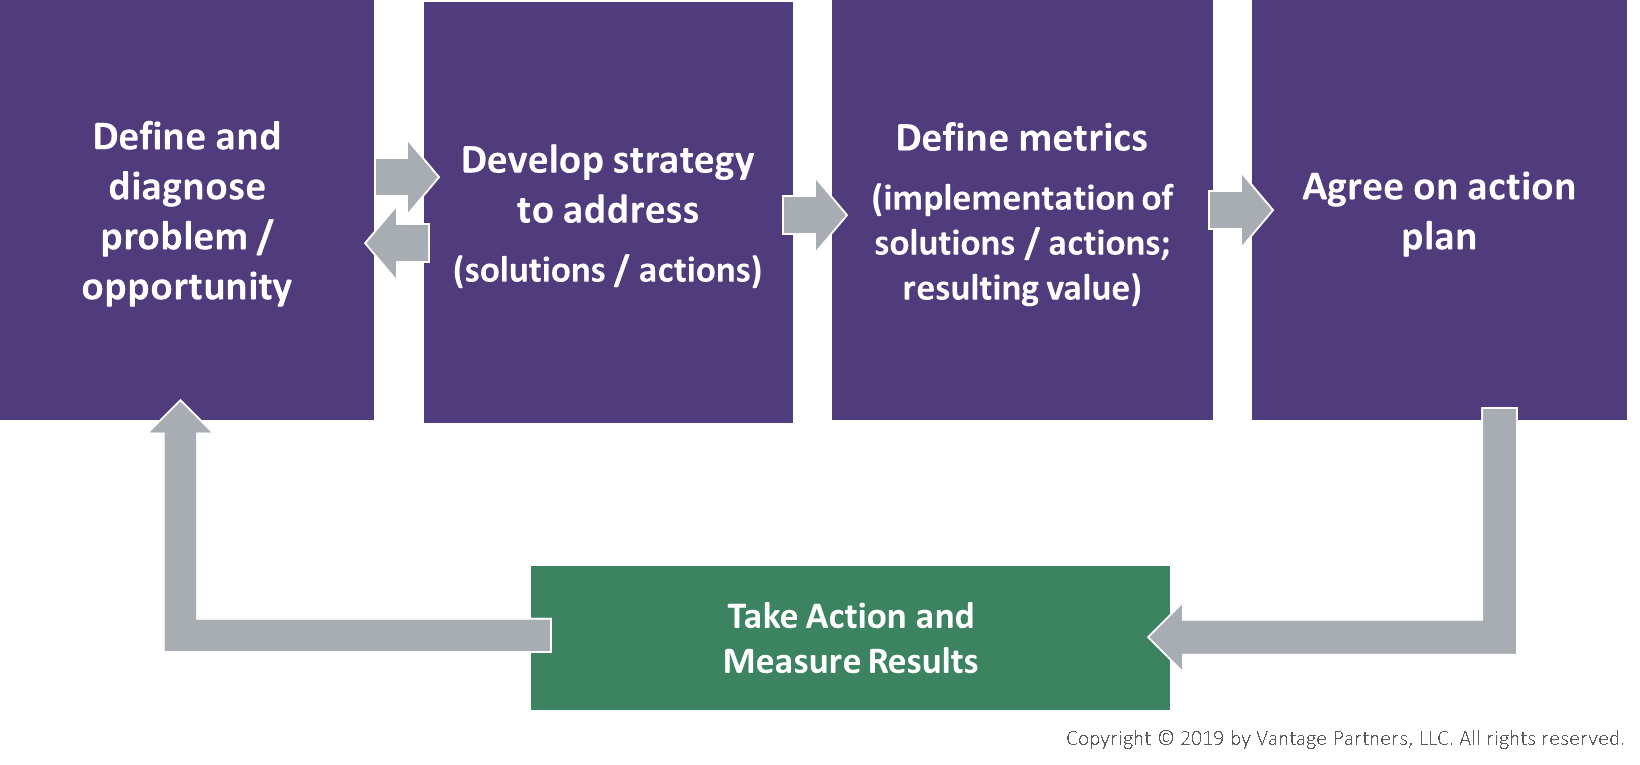
4. Situate metrics in a process that facilitates continuous learning and improvement. Defining useful metrics is only the first step. Metrics rarely provide definitive answers. Rather, their value is to catalyze conversations and ground planning and decision-making in a common fact base. They need to be used as part of a complete management system that enables effective problem identification and diagnosis, that produces concrete plans to drive measurable improvement, and that enables continuous learning.
Figure D: Continuous innovation and improvement process
Authors: